Detecting variants shared between traits, detecting potential causality from GWAS summary data

Pickrell et al. (Pickrell et al., 2016) come up with a very nice approach which uses summary-level data to detect variants exhibiting effects on multiple traits. They also propose use of multi-locus information to infer causative relations between traits1.
The manuscript starts with reminding the reader that the observed association between a genetic variant and multiple traits (pleiotropy) could mechanistically be due to independent effects of the variant on the traits, but also through a mechanism where genetic effect on (higher-level) trait is mediated by the effect on the (lower-level) trait. Consequently the authors formulate the aim of this work as “to systematically perform a genome-wide search for genetic variants that influence pairs of traits and then to interpret these associations in light of the causal and non-causal models”. They do so by investigating summary-level data from large GWAS of 42 (complex) traits.
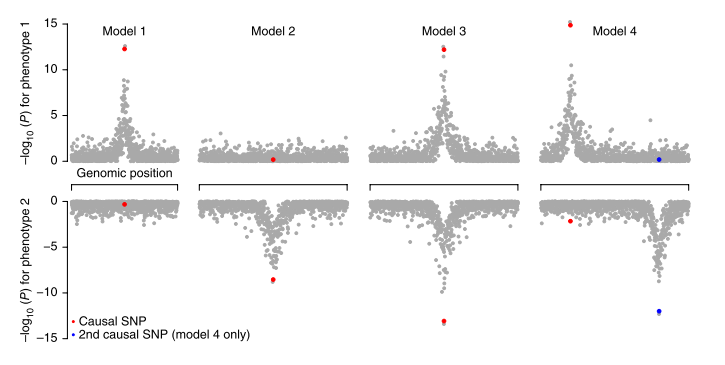
For pairs of traits, the authors extend the model of (Giambartolomei et al., 2014) to estimate the probabilities of four model regarding SNPs causal for the traits (see Figure 1 of the manuscript). Using this model, they estimated the proportion of detected variants shared between traits, coming up with biologically meaningful clusters of traits2. They next examine specific loci influencing multiple traits. This totalled to 341 region, ‘trivial’ (e.g. TC-LDL) overlaps aside. The champion SNP was the rs3184504 from SH2B3 locus, which popped up for 8 traits at p<5e-8 (conventional single trait genome-wide significant level). Interestingly, the next region in this ranking contains ABO histo-blood groups. The authors anecdotally note that variants which influence large number of phenotypes seem to be frequently non-synonimous, unlike the general pattern observed for complex traits.
The authors next hypothesise that in case a variant affects two traits via shared molecular mechanisms, one should observer consistent relation between effects of the variant on the traits. They have found a number of not-so-trivial and biologically appealing relations. For example, they show that the variants associated with increased age at menarche tend to be associated with decreased BMI, reduced risk of male-pattern baldness, and increased hight; most of these variants also delay age at voice drop, so the interpretation may be that these variants influence pubertal timing in general3.
Finally the authors had a go onto possible causal relations between traits. Here, they applied a very smart trick of looking whether variants implicated in trait one pop up (with consistent effect) for the trait two, and vica versa4. The idea may be better understood by looking into example they provide: while variants associated with higher LDL do appear as risk-increasing for CAD, if one looks at variants which are implicated in CAD, their effects on LDL are rather arbitrary. One explanation is that LDL os one of may causal factors contributing to the risk of CAD (or, that that LDL is in very strong genetic correlation to the causative factor). Using this reasoning, the authors identify four putatively causal trait pairs (BMI -> TG, LDL -> CAD, BMI -> T2D, hypothyroidism -> height). The fact that these relations are kind of ‘expected’ serves as a nice proof of principle.
To conclude: Pickrell at al. come up with very nice approach to detect variants which exhibit effects on multiple traits, and propose using multi-locus information to infer causative relations between traits. All methods work on summary-level data, which makes them especially valuable. Altogether their approach is sound and seems to work very well5. They implement the methods in gwas-pw software. We at PolyOmica are looking forward to apply these methods to better understand complex traits and diseases we study!
Random thoughts and question:
- the authors say that “in general, it is not possible to distinguish a single causal variant that influences both traits (model 3 in Fig. 1) from two separate causal variants (model 4 in Fig. 1) in the presence of strong linkage disequilibrium (LD) between the causal variants” – we wonder if this is still the case for alleles that are in strong LD but are exhibiting opposite effects on the trait (this is btw the scenario when multi-SNP model has much greater power cf standard single-SNP model).
- “the model gives a small overestimation of the proportion of shared effects” – we wonder whether this could be fixed (and whether it makes sense to do so)
- “in pairs of GWAS where … there are no overlapping individuals … we saw that correlation in summary statistics was non-zero, indicating that we are correcting out some truly shared genetic effects on the two traits” – we wonder how big were correlations? wrt ‘overcorrection’ we wonder if there is a potential for our GRAMMAR-type of methods to avoid over-correction
Nice detail:
“for studies that were not done using imputation to all variants in Phase 1 of the 1000 Genomes Project, we performed imputation at the level of summary statistics with ImpG”
References
Footnotes
- The general focus of the work is similar to that of Zhu et al., which we have discussed in a recent post
- While this may sound somewhat similar to what LD score regression does, this method is not intended to estimate genetic correlation, and does not give such estimate unless some (unrealistic) conditions are fulfilled
- one may speculate that this specific task may be solved more effectively by LD score regression
- Something to think of — how this idea is influenced by unequal sample sizes used in GWAS for different traits
- It should be noted that their statistical approach is somewhat hybrid; e.g. for step one they use Bayesian type of reasoning. But this may be the way to go in this setting; see also note 7 to this post
No Comments